Technical analysis is one of the methods to predict stock price movements. It is dependent on tracking the price movements based on various charts and patterns and gathering insight from the same. This is based on the assumption that the participants of the market i.e. sellers and buyers – have no information asymmetry and are valuing the stock at its fair value.
Importance
Although there are various debates on the importance of technical analysis, mentioned below are the major points for why one should use technical analysis.
- It works best for traders with a short time horizon. One can use technical analysis to trade for a 5 hour window as well.
- One can potentially estimate the time period of a stock being undervalued or overvalued.
- It helps determine a potential price range for entering & exiting a specific security or a contract.
- The worst enemy of a trader or an investor is their emotions. If followed diligently, technical analysis can help counter this risk.
Technical Charts
There are a good deal of technical charts and patterns that one can analyze. However, in this article we will restrict to the most common and effective ones.
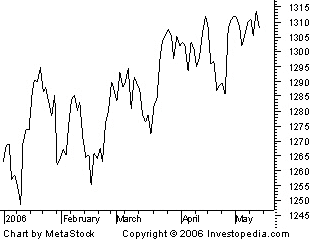
- Line charts – This is the most common and basic chart for analyzing price movements of a stock. It simply shows the movement of the price of a security in a given time frame. Time frames can range from hourly, weekly, monthly & yearly. This is usually the 1st step before one delves into more complex chart patterns. It gives an idea of the how stock has been performing in the selected time period. The chart depicts price on the y-axis and time period on the x-axis.
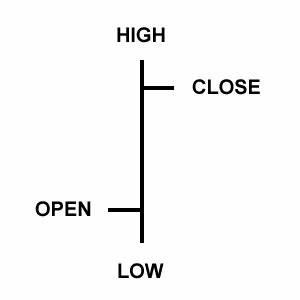
- Bar charts – Bar charts help us track the volatility of a specific security or index. It displays the volatility for each trading day. It is similar to a line chart, however it gives 4 points of information.
As depicted in the image below, it shows a long vertical line with two horizontal line protruding from the top and bottom of it. The top and bottom of the vertical lines provides information on the highest and the lowest price respectively, whereas the bottom and top horizontal lines depict the open and close price respectively. It is also a part of an intraday-chart as it is mostly used to analyze the stock for intraday trades.
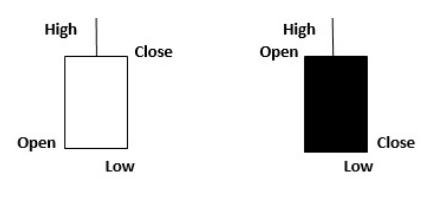
- Candlestick charts – Candlestick chart is an improvement of the bar chart. It shows similar information in a better manner. Moreover, it depicts the volatility for the given time frame instead of only daily ones. This chart consists of a rectangle body with vertical lines protruding from the top and bottom of it. The upper and lower end of the body signifies the opening and closing prices, while top and the bottom line shows the highest and the lowest price. Candlestick have two colors generally white and black. White (lighter) signifies that the closing price is higher than the opening price and vice-versa for black (darker). The more the color change, more is the volatility of the stock.
Technical Indicators
Most common technical indicators are trend lines and trend length. These are the most basic technical analysis that is done on any kind of chart.
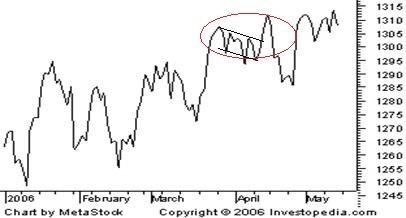
- Trend Lines : It is a straight line that connects all tops and bottoms of a price chart with each other. It is difficult to analyse a price movement because of the sheer fluctuations in the stock price. Trend lines help us remove the chaos and bring some structure to the price action. As the name suggest it helps us identify the trend of the price movement. A “channel” of two straight lines is drawn; One which connects the top and the other which connects the bottom. E.g. An uptrend is marked by increasing tops as well as increasing bottoms. In the image below, the trend lines have been marked in red.
- Trend Length : Apart from analysing the trend lines and different charts, it is also important to predict the length of the trend. We need to know for how long the trend is going to sustain itself. There are two types of lengths, namely; Primary & Secondary. Primary lengths are the long-lasting ones and brings a fundamental shift in the price of the stock. Secondary lengths are minor changes in the price movement that are not sustainable and they go off with the blink of an eye. Trend lengths can be predicted by carefully analysing the trend lines, e.g. each time a trend line suggests that the stock prices fall to a lower level than the previous one before rising, it is suggestive of a downtrend.
Technical Patterns
After analysing the various charts and trends we now need to look for patterns in them. In this section we will explore some of the most critical and renowned patterns that serve as important technical patterns.
- Candlestick Dojis – Dojis show the indecisive nature of the market. They give a potential signal for a forthcoming market trend reversal. The basic characteristic of a doji is that the opening price and closing price is the same, reducing the candlestick rectangle body merely to a horizontal line. There are 4 different types of Dojis:

- Long legged Doji – This is a typical doji, where the price moves equally in each direction, opening and closing prices in the middle of the price range for the given time period. When such a pattern emerges after a prolonged uptrend or a downtrend it is an indication of market reversal.
- Dragonfly Doji – This pattern signifies a rejection of the extended downside move. When such a pattern emerges after a prolonged downtrend, it signals an impending uptrend. We can observe that the price recovers from its lowest point to close at the highest point in the given time frame.
- Gravestone Doji – As the name suggests, a downfall is forthcoming. When such a patterns appears after an extended uptrend, it signals a shift in the market towards the downside.
- Four Price Doji – This suggest that buying, closing, lowest and the highest prices were the same. The participants were highly indecisive and hence are unsure of the stock price movement.
- Moving Averages – These are simple and exponential averages of stock prices in a continuous time frame. E.g. A 50-day moving average will be a arithmetic mean of a given set of prices over the past 50 days. This indicator signals the possible trend of the stock and is completely customizable as per ones requirement. They are widely used amongst market participants because of its easy interpretation and customization. Moving averages crossovers is another concept, when e.g. a 50 day moving average crossovers a 100 day moving average from below it may signal a buy strategy. The significance of the moving average is most with the highest number. E.g. when the stock price crossovers (beats) a 200 day moving average it will signify an uptrend stronger than when it crossovers (beats) a 5 day moving average.
Conclusion
Technical Analysis can prove to be a complement for fundamental analysis. It gives a sense of the market trend and it concretizes with experience. No analysis promises 100% returns, although it enables the market participants to take calculated risks. It is advisable for investors and traders to understand the concepts in-depth and then start small with real money. The technical concepts mentioned above are the most basic ones that should be mastered before delving into advanced topics. In all, these technical indicators, charts and patterns are enablers and it is meant to support your hypothesis.
Greetings! Very useful advice in this particular article! Its the little changes that will make the biggest changes. Thanks for sharing!
We are a group of volunteers and starting a new scheme in our community. Your website provided us with valuable information to work on. You’ve done an impressive job and our whole community will be grateful to you.
you’re really a good webmaster. The website loading speed is incredible. It seems that you are doing any unique trick. Moreover, The contents are masterwork. you’ve done a excellent job on this topic!
Thanks for your blog, nice to read. Do not stop.
I really like your writing style, great info , thankyou for posting : D.
I wanted to thank you for this fantastic read!! I certainly enjoyed every little bit of it. I have got you saved as a favorite to check out new stuff you postÖ