Introduction
Successful stock trading requires the ability to identify patterns and trends in market charts. One such pattern that has gained prominence among traders is the Head and Shoulders pattern. This article aims to explain what the Head and Shoulders pattern is, its advantages, drawbacks, and the industry where it is best utilized.
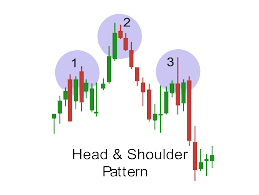
What is the Head and Shoulders Pattern? The Head and Shoulders pattern is a technical analysis chart pattern that signals a potential reversal in the price trend of a stock. It typically consists of three peaks, with the central peak being the highest (the “head”), flanked by two smaller peaks (the “shoulders”). The pattern resembles a human head and shoulders and is often considered a bearish indicator when it forms after an uptrend.
Advantages of the Head and Shoulders Pattern
Reversal Signal: The primary advantage of the Head and Shoulders pattern is its ability to signal a trend reversal. Traders use this pattern to identify a shift from an upward trend to a potential downward trend, providing an opportunity to sell existing positions or initiate short positions.
Target Price Projection: The Head and Shoulders pattern also offers a target price projection for the potential downside move. By measuring the vertical distance from the “head” to the “neckline” (the line connecting the lows between the shoulders), traders can estimate the expected decline in the stock’s price.
Confirmation with Volume: Volume analysis is often used to validate the Head and Shoulders pattern. A substantial increase in volume during the formation of the right shoulder or during the breakdown of the neckline adds more credibility to the pattern, increasing the likelihood of a successful reversal.
Drawbacks of the Head and Shoulders Pattern
False Signals: Like any technical analysis pattern, the Head and Shoulders pattern is not foolproof and can generate false signals. It’s crucial to consider other indicators and factors to confirm the pattern before making trading decisions. Relying solely on the pattern may lead to incorrect predictions.
Ambiguous Neckline Placement: Determining the exact placement of the neckline can be subjective, as different traders may draw it differently. This subjectivity can lead to variations in target price projections and potential false breakouts or breakdowns.
Time-consuming Analysis: Identifying the Head and Shoulders pattern requires careful observation and analysis of price charts. It may take time to spot and confirm the pattern, especially in volatile markets. Traders need to exercise patience and diligence to ensure accuracy in their predictions.
Industry Best Use: The Head and Shoulders pattern can be applied to stocks in various industries. However, it is particularly useful in industries that are sensitive to economic cycles or undergo significant transformations. Sectors like technology, consumer discretionary, and industrial goods often exhibit patterns that align well with the Head and Shoulders formation due to changing market conditions and investor sentiments.
Conclusion
The Head and Shoulders pattern is a powerful tool in a trader’s arsenal, providing valuable insights into potential trend reversals in stock trading. Its advantages lie in its ability to signal reversals, offer target price projections, and provide confirmation with volume analysis. However, traders must remain cautious of false signals and the subjective nature of drawing the neckline. With proper analysis and consideration of other indicators, the Head and Shoulders pattern can enhance decision-making and improve trading outcomes across various industries.